Download the original 2026 Q3 Quarterly Letter (PDF)
Financial markets delivered mixed results in the third quarter, though most major equity markets remain solidly positive for the year. U.S. stocks, as measured by the S&P 500, rose 2.0% during the quarter and are now up 11.8% year-to-date (excluding dividends). The stocks of smaller U.S. companies moved in the opposite direction, with the Russell 2000 declining 7.5% in the quarter, though it remains up 12.7% for the year. International equity markets were relatively flat during the quarter, with developed markets (MSCI EAFE) up 0.3%, emerging markets down 1.0%, and the broader MSCI ACWI Ex USA index down 0.1%. Despite the lackluster quarter, international stocks have generated strong returns year-to-date, led by emerging markets, which are up 21.4%. Fixed income markets were more challenging, as the Bloomberg U.S. Aggregate Bond Index declined 3.5% during the quarter and is now down 2.9% for the year, while municipal bonds were down 6.3% in the quarter and 4.2% year-to-date.
| Equity Indexes | Q3, 2026 | YTD | 2025 | 2024 | 2023 |
|---|---|---|---|---|---|
| S&P 500 | 2.0% | 11.8% | 16.4% | 23.3% | 24.2% |
| Russell 2000 (Small Cap) | -7.5% | 12.7% | 11.3% | 10.0% | 15.1% |
| MSCI EAFE (Developed) | 0.3% | 8.1% | 27.9% | 1.1% | 15.0% |
| MSCI Emerging Markets | -1.0% | 21.4% | 30.6% | 5.1% | 7.0% |
| MSCI ACWI Ex USA | -0.1% | 12.1% | 29.2% | 2.9% | 12.6% |
Note: Equity index returns exclude dividends. Fixed income index returns reflect total return.
| Fixed Income Indexes | Q3, 2026 | YTD | 2025 | 2024 | 2023 |
|---|---|---|---|---|---|
| Bloomberg U.S. Aggregate Bond | -3.5% | -2.9% | 7.3% | 1.3% | 5.5% |
| Bloomberg Municipal Bond | -6.3% | -4.2% | 4.2% | 1.1% | 6.4% |
The most consequential market development during the quarter was the sharp rise in long-term interest rates. Higher rates weighed directly on bond prices and pressured traditionally interest-rate-sensitive areas of the equity market, including utilities and real estate. One factor contributing to renewed inflation concerns was the rise in energy prices following the end of the Iran ceasefire in early July. Higher oil prices complicated what had previously been an improving inflation picture and reinforced concerns that inflation, and therefore interest rates, could remain elevated for longer.
Interestingly, the same development that created a headwind for bonds and rate-sensitive stocks provided a significant tailwind for energy companies. Energy was the best-performing equity sector during both the third quarter and year-to-date, which benefited our portfolios given our overweight position in the sector. This is a good example of one of the benefits of diversification: an economic development that creates pressure in one portion of a portfolio can simultaneously create opportunities in another.
Why We Own Bonds
Given the weakness in bonds during the quarter, we suspect some clients may be asking a familiar question: if cash provides an attractive yield without the day-to-day price volatility of bonds, why not just own stocks and cash and avoid owning bonds at all?
We think there are several important answers to that question. First, losing money in high-quality bonds over a full calendar year has historically been relatively unusual. Over the past 50 years, the Bloomberg U.S. Aggregate Bond Index has generated positive returns in 45 of those years. Bonds can and do experience temporary declines when interest rates rise, as we saw again this quarter, but historically those periods have tended to be relatively infrequent. In fact, the average intra-year decline in the Aggregate Bond Index over that period was approximately 3.5%, similar in magnitude to the decline experienced during the third quarter.
The second reason we own bonds is their diversification value. Over the past century, there have been 25 calendar years in which U.S. stocks generated negative returns. Bonds produced positive returns in 21 of those 25 years. This historical tendency for bonds to perform well when equities are under pressure is one of the primary reasons we include them in balanced portfolios. When economic conditions deteriorate and stocks fall, interest rates often decline as investors seek safer assets and the Federal Reserve responds to weaker growth by lowering short-term borrowing costs. Falling rates cause bond prices to rise, helping cushion the decline in the equity portion of a portfolio.
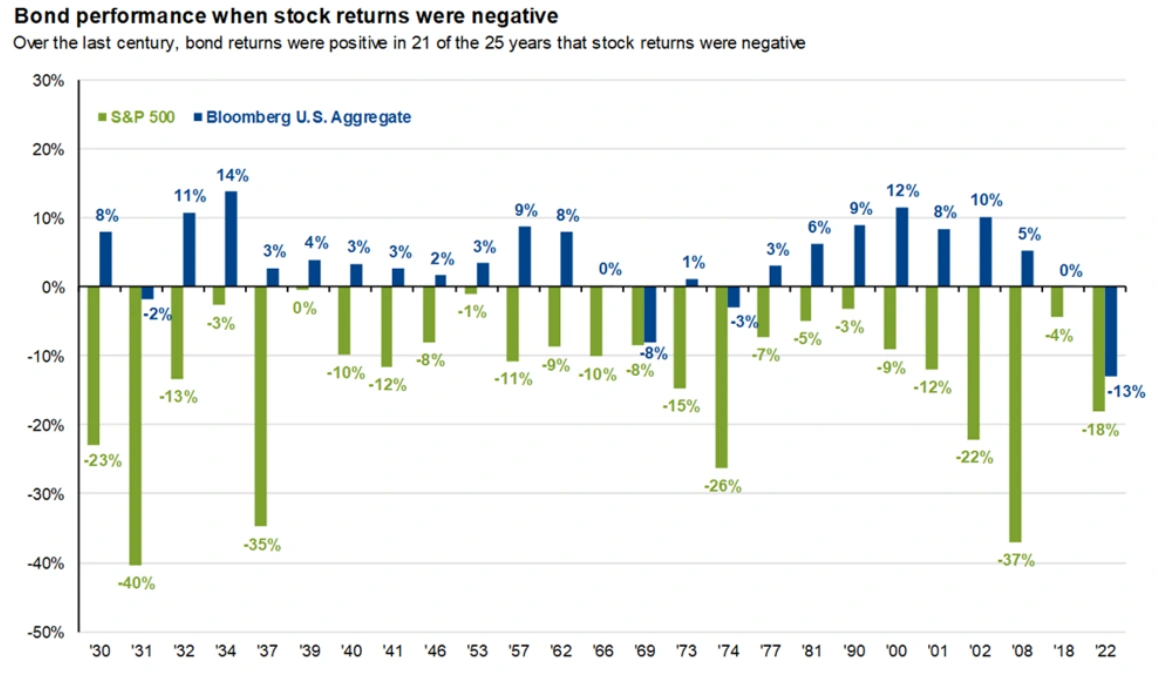
That relationship does not work perfectly every year. The most notable recent exception was 2022, when rapidly rising inflation caused both stocks and bonds to decline sharply at the same time. That made 2022 unusually painful for balanced portfolios, but it was an exception rather than the historical norm.
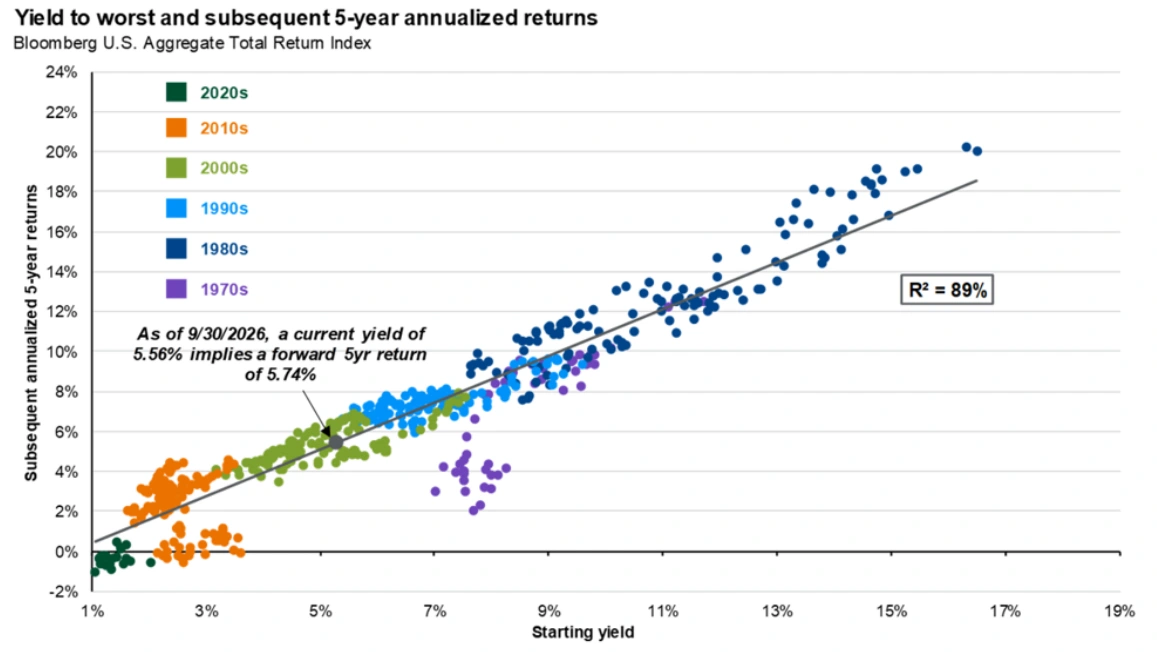
Perhaps most importantly, the same rise in interest rates that has hurt bond prices recently has also materially improved the return opportunity going forward. One of the better predictors of long-term bond returns is the yield available when the investment is made. The chart below compares the starting yield on the Bloomberg U.S. Aggregate Bond Index with its subsequent five-year annualized return. As the chart demonstrates, the historical relationship has been quite strong.
At the end of September, the Aggregate Bond Index yielded approximately 5.6%. Based on the historical relationship shown below, that starting yield would imply a subsequent five-year annualized return of approximately 5.7%. There are obviously no guarantees that history will repeat itself, and interest rates could certainly move higher from here. However, this represents the most attractive forward return setup for high-quality bonds in more than 20 years. Moreover, the current starting yield also compares favorably to cash, with current money market rates in the 3.50% to 3.75% range.
None of this means we are indifferent to interest-rate risk. In fact, our balanced portfolios have carried a relatively heavy allocation to cash throughout the year, and that cash has come largely at the expense of bonds rather than stocks. In our most common 70% stock/30% fixed income allocation, roughly 3%-7% of the total portfolio has been held in cash, leaving approximately 23%-27% invested in bonds. We also took steps during the third quarter to further reduce interest rate risk. We shortened the duration of our fixed income holdings by selling DMBS (DoubleLine Mortgage ETF) and reallocating those proceeds to BSIIX (Blackrock Strategic Income fund), which has lower interest-rate sensitivity. As a result, our fixed income portfolios currently have a shorter duration than the Bloomberg U.S. Aggregate Bond Index. That positioning helped cushion some of the impact of rising rates during the quarter and, along with other fixed income decisions, has contributed to modest outperformance relative to the bond benchmark year-to-date.
Equity Update - AI and Energy
On the equity side, performance has been driven primarily by two sectors - Energy (+37.6%) and Technology (+36.0%). Given that AI-related industries still account for more than 50% of the index, artificial intelligence continues to be the dominant investment theme in the equity market. Spending on semiconductors, data centers, power infrastructure, networking equipment and software continues at an extraordinary pace, providing meaningful support to both economic growth and corporate earnings.
We have benefited materially from this investment cycle over the past several years, but we have also continued to reduce selected positions as valuations and expectations have risen. This is not because we believe AI is a fad or because we are trying to predict an imminent end to the cycle. We continue to believe AI will have significant long-term economic implications. At the same time, the scale of current investment is unprecedented, and history suggests that even the most transformative technologies experience periods in which investment gets ahead of near-term demand and spending pauses while demand catches up.
We do not know when such a pause will occur, and it is entirely possible that AI-related companies will continue to perform well in the meantime. Rather than attempting to identify the exact top of the cycle, we have been gradually reducing exposure as prices, valuations and expectations rise. That approach may cause us to leave some potential gains on the table if the rally continues, but we are comfortable making that trade-off when we believe the balance between potential return and risk has become less attractive.
Taken together, our recent portfolio decisions, maintaining an overweight position in energy, reducing the interest-rate sensitivity of our bond holdings, and gradually trimming some of the largest beneficiaries of the AI investment cycle, reflect the same underlying philosophy. We are not making dramatic all-in or all-out bets based on short-term forecasts. Rather, we are adjusting portfolios incrementally as valuations, fundamentals and the balance between risk and potential return change.
Periods like the third quarter are a useful reminder that diversification does not mean every investment will rise at the same time. In fact, that is not what we want. Different investments are included in portfolios because they respond differently to changes in economic conditions, inflation, interest rates and investor sentiment. Our objective is to combine those investments thoughtfully, rebalance as opportunities change, and remain disciplined through the inevitable periods of volatility that accompany long-term investing.
As always, please do not hesitate to contact us with any questions or concerns you may have regarding your individual investment portfolio.
Your Whitney Advisor Team
Disclaimer: We recommend you review and consider any recent market news. All expressions of opinion are subject to change without notice in reaction to shifting market or other conditions. Its accuracy, completeness or reliability cannot be guaranteed. Nothing contained in this message should be construed as a recommendation.